Pre-Launch founding rate closes May 31, 2026.
Your team adopted AI tools.
Your lead time got longer.
AI made your engineers faster at writing code. It didn't fix your PR review queue, your deploy process, or your incident response. The bottleneck moved, and if you don't know where it is now, neither does your VP.
Deloitte surveyed enterprise organisations this month. 74% expected revenue growth from AI. 20% are seeing it. The gap lives in the pipeline, and it's measurable.
That gap is widening fast. 78% of knowledge workers now use AI agents weekly - up from 12% in 2024. Most engineering teams lack a measurement baseline for what those agents are doing to their pipelines.
Pull your team's complete DORA baseline, identify your primary bottleneck, and write your first experiment hypothesis - in 90 minutes.
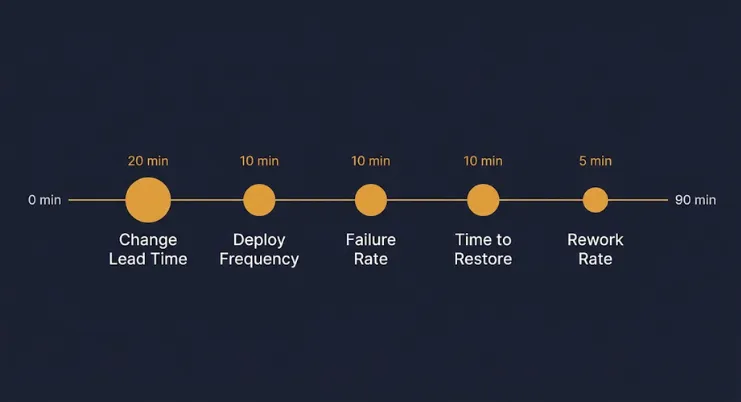
The Complete Baseline
Change Lead Time, Deployment Frequency, Change Failure Rate, MTTR, Rework Rate.
Andrej Karpathy renamed the thing this course is about.
In May 2026, on the one-year anniversary of coining the term "vibe coding," Andrej Karpathy formally retired it in favour of "agentic engineering." The distinction is precise:
Vibe coding raises the floor. Describe what you want, accept what comes back. Anyone can do it. Useful for prototypes and personal tools.
Agentic engineering raises the ceiling. The professional discipline of coordinating fallible AI agents while preserving correctness, security, taste, and maintainability. Specs, supervision, diff inspection, tests, evaluation loops, permissions, isolated worktrees, quality control.
In Karpathy's words: "Vibe coding is fine for prototypes and personal tools. Agentic engineering is what serious teams need."
Most engineering managers right now are leading teams that claim to be doing agentic engineering, while the actual practice on the ground is closer to vibe coding. The pipeline data is what you use to tell the difference. The 90-Minute Cycle Time Audit is how you pull the pipeline data.
You finished the email course. Now what?
You know the framework. Change Lead Time, Deployment Frequency, Change Failure Rate, MTTR, Rework Rate. You can explain what each one measures. You understand why they matter.
But when someone asks you: "What are your team's DORA numbers?" - you don't have an answer.
Not because you haven't tried. Because pulling real data from Jira or GitHub, knowing what to count and what to ignore, and figuring out which metric to focus on first, that's a different skill from knowing the theory. And nobody's shown you how to do it for your actual team.
So you're stuck in the gap. Past the reading stage. Not ready for a coaching programme. Just needing someone to sit next to you, virtually, and walk you through the data pull.
That's what this course is for.
"I estimated our lead time at about 5 days. The data said 11."
"I had no idea 20% of our deploys were cleaning up the previous one."
"I knew we had a bottleneck. I didn't know which one to fix first."
These aren't quotes from surveys. They're what engineering managers say in the first session after they actually pull their numbers.
The benchmarks confirm it. 39.5% of engineering teams are running a change failure rate above 16%, which is the Low tier. Most don't know until they measure.
LinearB measured 8.1 million pull requests across 4,800 organisations this year. AI-generated PRs have an acceptance rate of 32.7%. Human-authored PRs: 84.4%. Every rejected AI PR is another review cycle. Another day in the queue. Another reason your lead time is going in the wrong direction.
Three independent datasets. The same conclusion: AI writes code faster. The pipeline absorbs the cost.
What DORA just said
The authoritative voice in software delivery just published the thesis on which this course is built.
On May 11, 2026, the DORA team at Google Cloud released The ROI of AI-Assisted Software Development
"The greatest returns on AI investment come not from the tools themselves but from a strategic focus on the underlying organizational system."
"We don't measure AI by the code it writes, but by the bottlenecks it clears."
That second line is this course in one sentence.
And 94% of engineering leaders already know it.
Two days after DORA, Harness published The State of Engineering Excellence 2026. Sapio Research surveyed 700 engineering leaders across five countries and found:
89% say AI has improved productivity
94% acknowledge that those same metrics miss tech debt, validation time, and burnout
Only 6% believe their current frameworks can close that gap
Leaders trust their numbers and admit those numbers miss what matters. Both at the same time. This is the audit's reason to exist. You do not have to be convinced. The data already says you are.
The J-Curve: why your AI investment isn't returning yet
The report introduces a model DORA calls the J-Curve. Organisations adopting AI tools experience a temporary productivity dip before any long-term gain. Three things drive the dip:
Learning curves as teams adapt their workflows
Verification costs from reviewing AI-generated code
Downstream process adjustments as the pipeline catches up
DORA names this period "the tuition cost of transformation." If your team's lead time and change failure rate are sliding in the wrong direction despite AI adoption, you are not failing. You are paying tuition. The question is whether you can name where the cost is going and shorten the dip.
That is what the 90-Minute Cycle Time Audit does.
The numbers DORA puts on it
For an illustrative 500-person engineering organisation in the report:
First-year return: ~$11.6M
Investment: $8.4M
ROI: 39%
Payback: ~8 months
Most of that return comes from the measurement-and-experiment loop, not from the AI tools. Without the loop, the same investment goes sideways or backwards.
The course gives you the loop for the team you actually run, in 90 minutes.
The 90-Minute Cycle Time Audit
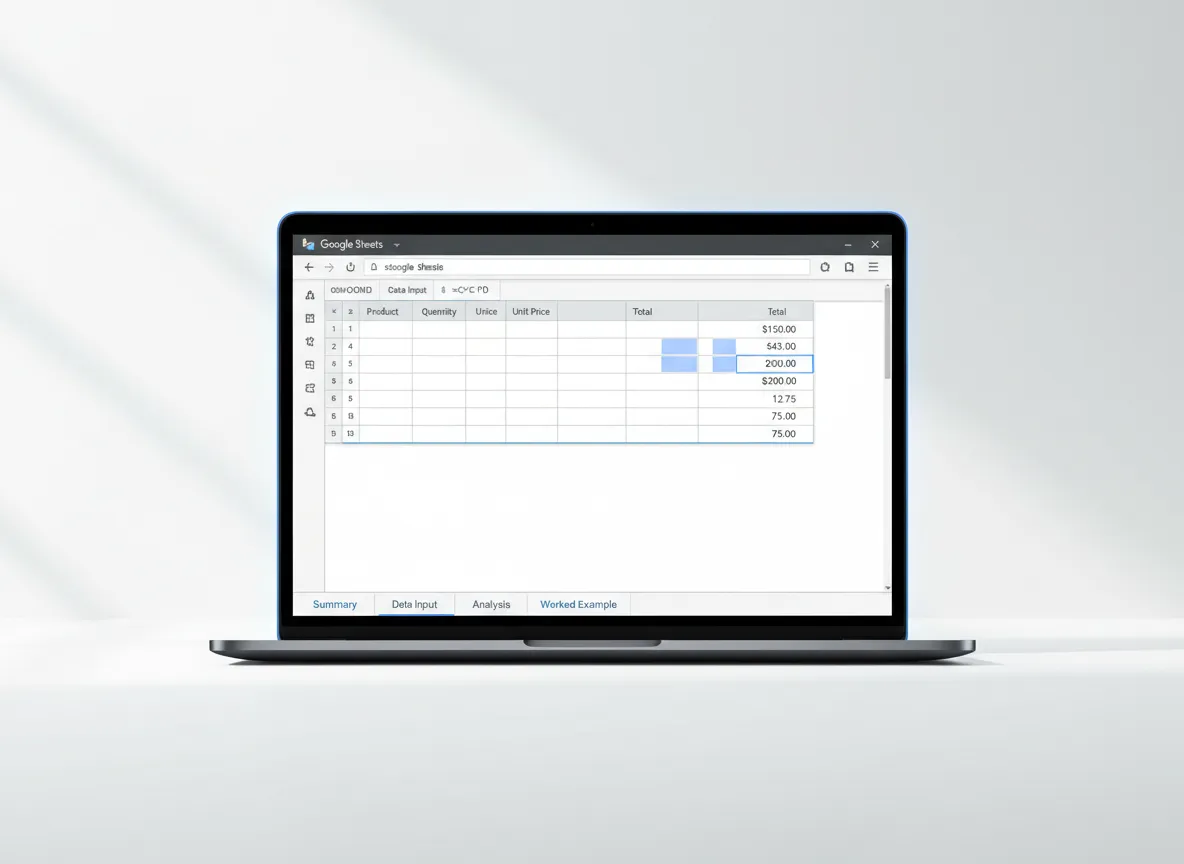
A self-paced video course with a Google Sheet workbook.
By the time you finish, you have three things:
1. A complete DORA baseline
All five metrics. Real numbers from your team's actual tools - Jira, GitHub, your CI/CD logs, your incident channel.
2. A named primary bottleneck
Not a list of areas to improve. One metric, one pattern, one root cause - the thing that's costing your team the most time right now.
3. A written experiment hypothesis
The kind you can take to your next sprint planning. Something your team can start this week - no budget request, no all-hands, no procurement.
PROGRAM ROADMAP
How it works
Here's what we cover:
00
Welcome & Setup (5 min)
Before you pull a single number, you'll have the workbook open, your access confirmed, and 30 minutes of focused time blocked. Setting up done right makes everything else faster.
01
The Diagnostic Framework (10 min)
A confident recap of the five-metric model, not a repeat of the email course. We go deeper: why Speed + Stability + Honesty form a complete picture, why these metrics are hard to game, where DORA's J-Curve says your team currently sits, and what Stackwell Engineering's baseline looks like before we dig in.
02
Pulling the Five Metrics (55 min)
The core of the course. For each metric, I screen-share the data pull on Stackwell's fictional Jira and GitHub so you can see exactly what to do. Then you pause and pull your own numbers.
Two screen-share tracks for each metric: Jira (primary) and GitHub (alternative).
2a - Change Lead Time (20 min - weighted)
The metric most managers are most wrong about. Includes the AI tools trap: why Copilot adoption often makes this number worse before it gets better.
2b - Deployment Frequency (10 min)
How to spot hidden deploy freezes that inflate your average.
2c - Change Failure Rate (10 min)
What counts as a failure, what doesn't, and how to cross-reference your deploy log with your incident channel.
2d - Mean Time to Restore (10 min)
Clock starts at impact, stops at restoration. How to find the right timestamps in PagerDuty, Jira, or Slack.
2e - Deployment Rework Rate (5 min)
The metric that catches teams who look fast but are secretly cleaning up. Usually, the biggest surprise.
03
Reading the Results (15 min)
Remove yourself from the day-to-day by implementing advanced automation and delegation frameworks. Achieve sustainable growth without burnout.
04
Designing Your First Experiment (15 min)
The hypothesis framework. Five proven first experiments matched to the five bottleneck types. You'll write your hypothesis in the workbook, testable, sprint-sized, zero budget required.
05
Keeping the Loop Going (5 min)
The one-slide version for your VP. What to do when an experiment doesn't move the metric. And how to know when you're ready for more than self-directed work.
MASTER TEMPLATE
Included Google Sheet Workbook
Ten tabs. Pre-filled with Stackwell Engineering's data so you always have a worked example alongside your own.
Every data entry tab has:
- Clear instructions at the top. You'll never have to guess what to do next
- Jira and GitHub instructions side by side
- Automatic DORA tier calculation (🟢 Elite / 🟡 High / 🟠 Medium / 🔴 Low)
- A Stackwell worked example in every metric tab
The workbook is a locked master; you make a copy to your own Google Drive before you start. Your data stays in your copy.
Who this is for
This is for you if:
You've completed the DORA in 8 Days sequence (or equivalent) and understand the framework
You manage an engineering team with access to Jira, GitHub, or similar tools
You want to actually measure your team - not just read about measurement
You're past the "should we do this?" stage and into the "how do I do this?" stage
You want to run your first experiment this sprint, not next quarter
You're being asked to lead "agentic engineering," and you suspect what's actually happening on your team is closer to vibe coding
This is NOT for you if:
You're new to DORA and haven't done foundational reading - start with DORA in 8 Days first (it's free)
Your team has no incident tracking, no CI/CD logs, and no version control history - there's no data to pull
You're looking for a consultant to do this for you - this course teaches you to do it yourself

MEET YOUR MENTOR
About Stuart
Over the past 25 years, I've had the privilege of leading engineering teams through some of the most complex scaling challenges in the tech industry. From early-stage startups to enterprise organizations, my focus has always been on building not just robust systems, but the capable, resilient people behind them.
I started Leading with Quality because I kept having the same conversation: an engineering manager who knew something was wrong, had a gut sense of the bottleneck, but had no data to back it up or act on.
This course is the version of that conversation I wish I could have had with every one of them.
STILL GOT QUESTIONS?
FAQ
Do I need to have completed DORA in 8 Days first?
Yes — or equivalent foundational reading. This course builds on the framework; it doesn't introduce it. If you're not familiar with Change Lead Time, Deployment Frequency, Change Failure Rate, MTTR, and Rework Rate, start with DORA in 8 Days first (free, 8-day email sequence).
What tools do I need access to?
Read-only access to Jira (or GitHub), your CI/CD logs, and your incident channel (PagerDuty, Slack, or equivalent). You don't need admin rights. If you can run a JQL query in Jira and see your deployment history, you have everything you need.
What if my team doesn't use Jira?
Every data pull in Module 2 has two screen-share tracks: Jira (primary) and GitHub (alternative). If your team uses GitHub and GitHub Actions as your primary workflow, you're covered.
How long does the data pull actually take?
Most students complete Module 2 in 60–75 minutes of focused work. The headline promise is 90 minutes total for all five modules. That's accurate if you've done the pre-work (access checklist, calendar time blocked) before you start.
What if my numbers are worse than I expected?
That's the point. Stackwell's director estimated 5 days for Change Lead Time. The data said 11. The gap between your gut estimate and your actual number is where the work is. This course is designed to help you act on that gap, not judge it.
What happens after I purchase?
You'll receive a welcome email with immediate access to the training modules and the Google Sheet workbook, along with details on how to access the community with fellow learners.
Your team's numbers are in your tools right now.
You just need 90 minutes to pull them.